DIYMobileAudio.com Car Stereo Forum banner

Determining -6, -12, -24 dB freq of 1st/2nd/4th order xovers?

8.6K views 16 replies 7 participants last post by  Bentxu  
#1 · (Edited)
This is something I've never understood and haven't been able to find an answer with on Google.

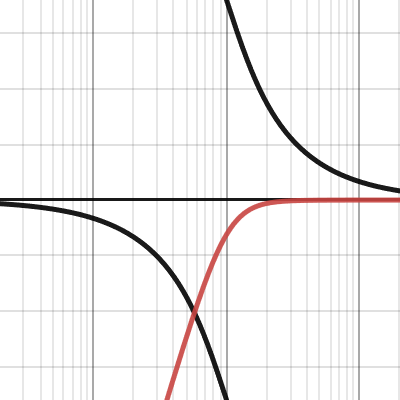
I know if you have a Butterworth crossover at 1000 Hz, the volume will be -3 dB at 1000 Hz. And if it's a Linkwitz-Riley crossover, it will be -6 dB at 1000 hz instead.

But what determines the first octave in the "dB per octave" slope? Is it one octave away from the crossover frequency, or one octave away from the frequency where the level first starts to drop off?

For instance, if you have a 1st-order BW highpass at 1000 Hz, will the level be -6 dB at 500 Hz? Or will it be -6 dB somewhere higher than 500, since the frequency where the level first began to drop below zero would be somewhere above 1000 Hz?
 
#2 ·
That's a good question and one that I struggled with for a long time too.

The crossover alignments have a transition period where the slope is gradually changing from an octave or two before the crossover frequency to an octave or so beyond the crossover frequency. More than an octave away from the crossover frequency the slope is mostly leveled off and you will see the quoted steepness like -6dB/octave, or -24dB/octave.

But in that transition zone near the crossover frequency, the exact behavior of the curve is not quite as predictable as your question wants to know. You can know for sure where the -3dB point is of a Butterworth and and -6dB point is on a Linkwitz-Riley. You can mostly predict the -12dB point on a 2nd-order slope is about one octave beyond the crossover frequency, similar to the -24dB point of a 4th-order slope also being close to one octave beyond the crossover frequency.

But except for the -3dB and the -6dB points, the numbers don't always line up perfectly like you (and many people including myself) want them to for simplicity.

The first free interactive source for this kind of thing that I can think of is my tuning tool in my signature below. You can adjust frequencies and slopes and see where the graphs end up. If you like, I can share the equations of the lines with you too.
 
#3 ·
The straight line approximation of a filter's magnitude response is called a "Bode Plot". You may want to read about these.

If you want the exact magnitude at any given frequency, then you need the equation for "magnitude response" of the particular filter topology and order. Read up on Butterworth topology at wikipedia - it has all your answers.

For example: this equation will give you exact magnitude of the filter response at versus frequency:

Image


"ω" is angular frequency (rads/s) and "n" is the order of the filter.

f(Hz) = ω/(2*pi)
 
#4 ·
Great, thank you guys. I had a feeling it was not as simple as I wanted it to be. But it makes sense that the slope is changing at every point around the crossover frequency as it transitions from being a flat line straight across to a flat line pointing at a downward angle.

I had read about Bode plots before but hadn't been able to wrap my head around the math. I studied the math again in that Wikipedia article and your post and finally figured it out. I couldn't see how the equation worked because it seemed like you'd need two frequencies - the one you wanted to determine the amplitude for and the crossover frequency. Playing around with it, I realized you have to make "ω" a ratio between the two frequencies. When they're the same, "ω" equals one and the result of the equation is -3.0103 dB.

So, I'm able to calculate amplitudes for any frequency on a Butterworth filter now. I found this graph showing slopes for different orders of Butterworth filters and confirmed the numbers I calculate match that graph.

I think I figured out Linkwitz-Riley filters, too. I read that they're just a squared Butterworth filter, so I just squared my equation, and when I set my frequency equal to my crossover frequency, I get an amplitude of -6.206. So, seems right, right?
 
#5 ·
This has been fun to play with. The reason I wanted to know was to be able to adjust manufacturer crossover point recommendations to account for different slopes. For instance, if a speaker has a recommended crossover point of 110 dB at 12 dB/octave or higher, I wanted to figure out an acceptable frequency if one uses a 24 dB slope instead.

So, I figured I could find the amplitude at the resonant frequency of the speaker with a 2nd-order filter, then find what 4th-order filter frequency yields the same amplitude at the Fs frequency. The speaker's Fs is 90, so:

Image


But I was surprised by just how much different the slope above the crossover frequency is. At 118 Hz, the 4th-order 100 Hz filter is almost 3 dB louder than than 2nd-order 110 Hz one.
 
#8 ·
Plus 1. Actually randomly watched that clip a week on scrolling through YouTube. Even knowing 90% of what he said in the crossover video I still learned alot things. I gotta see the stuff and I learn alot faster than reading only. I think crossovers, types are all just preference to each listener. I think less needs to be in the how's and more on just what sounds best.
 
#7 ·
If you're interested in recalculating crossovers for a high-pass application, you might want to look at woofer displacement too to make sure you don't exceed Xmax, for example. Excursion is also a function of power input and a few other things.

Below is a neat interactive webpage for this kind of thing. The second link is to another page with links to documentation of how to write all the equations, and also a place to download a version of the webpage simulation tool as an excel spreadsheet so you can tinker with it some more.

http://personalpages.tds.net/~fdeck/bass/speakerjs/speaker.html

Francis J. Deck

I used a lot of Francis's documentation when making one of the pages in my excel tool too. Neat stuff!
 
#10 ·
Image


I'm a big fan of Mark's videos (this is the video you guys are talking about, I think), but my numbers don't agree with his (around the 9:20 point). The first-order Butterworth is down 7 dB at 50 Hz, not 6 (ok, that's pretty close). The 2nd-order is down 12 dB at 50 Hz like he said. The 4th-order Linkwitz-Riley is down 48 dB at 50 Hz, though - not 24 like he said. Maybe someone can check my math though.
 
#11 ·
I haven't looked at the videos you linked, but I compared the chart you made above to the charts in Vance Dickason's Loudspeaker Cookbook and also my excel spreadsheet. Your 1st and 2nd-order Butterworth curves look correct at 100hz and 50hz. Your 4th-order LR curve is much too steep though. At 100hz it should be -6dB (and it is), but at 50hz it should be almost exactly -24dB (my equation puts it at -24.6dB). I'm not sure what you're using to plot the red line.

Also, when making charts, try setting the x-axis to log scale instead of linear.
 
#12 ·
Image


Well, I got it fixed, but I'm not sure why. In my equation, I was using 'w' raised to the power of 2 * 4, with the 4 since it's a fourth-order crossover. But changing that to 2 * 2 gets me the correct results. Not sure why?

I tried setting the x-axis to log scale, but Excel tells me I can't do that for negative numbers.
 
#13 ·
I use a different equation than Jepalan posted. Below is the one I like, and it is much more generalized. Much more complicated too, but if you're using excel then that's not a problem. I'm about to fall asleep now but maybe I'll find the source of it for you another time. The error you had might be related to a Linkwitz-Riley crossover being the square of a Butterworth filter, and maybe if you are squaring the Butterworth filter then the value for "n" needs to be different than what you think.

Try setting the x-axis to log scale, I mean the frequency axis, the horizontal one. The vertical scale with negative numbers is just fine the way it is.

Image
 
#14 ·
Ah, cool, I can see how that equation is similar but more general.

Ohhhh, the x axis. I saw logarithm and assumed you were talking about decibels and didn't think about which axis was x. That makes total sense - I didn't even think about how frequency plots are always done that way.

Thanks for all the help!
 
#15 ·
Heya,

I have tried to rebuild @Justin's formula in Google Sheets. However, it seems that the way I implemented it, the attenuation at the XO point is -3dB only in case of a second order BW filter.

For 1st order I get to -1.5, for 3rd order -4.5 and 4th order I get -6.

Does anybody know where I am going wrong?

The formula reads:

=20*log10(((A11/hpXOFreq)^order)/((1-(A11/hpXOFreq)^2)^2+(A11/(q*hpXOFreq))^2)^(order/(4)))

where

A11 = 6000
hpXOFreq = 6000
order = 1
q = 0.707

Gets me to -1.5dB attenuation.

Have tried with Google Gemini to find the problem but that was not entirely helpful.

Thanks for your support.
 
#16 ·
The formula you have is for a 2nd order filter only, and it will give you a -3dB point for butterworth when order=2 and q=0.707, and it will give you a -6dB point for a Linkwitz-Riley when order=4 and q=0.707. You're not doing anything wrong. It is just the formulas assume certain things that you maybe did not know.

The source for that formula is in the complex s-domain and found here:

I made an interactive demo of how I derived the Excel formula. This is a bit tricky because Excel does not handle complex numbers and so some algebra was needed to convert everything into real numbers:

If you want to find the transfer functions for others like 1st-order, then you need to use a different formula:

If you want to find other orders like 3rd-order or 5th-order, it gets more involved. You need to cascade combinations of the 1st-order formula with the 2nd-order formula, and you need to use very specific Q values that you can find in a lookup table. If you're interested in that, it is much more challenging but you can find info here:

and you can find the design tables here around page 8.42: